
Projections
Daily Strikeout Props Board
A site-facing read of the saved strikeout props artifact. The page keeps the underlying daily strikeout model intact, then layers in bounded lineup and pitch-matchup context to produce an adjusted mean and threshold ladder.
Overview
Props Snapshot
The page reads directly from the saved props artifact and keeps the public view centered on adjusted strikeout expectations and threshold probabilities.
Leaderboard
Matchup-Adjusted Strikeout Board
| Pitcher | Matchup | Base K | Adj K | Delta | 4+ | 5+ | 6+ | 7+ | 8+ |
|---|---|---|---|---|---|---|---|---|---|
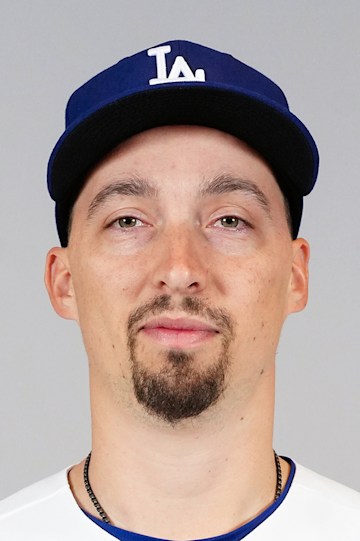
Blake Snell
Probable | projected
|
LAD vs SF
Score 76.5 | Lineup K 6.46
|
5.75 | 6.13 | +0.38 | 81.5% | 68.8% | 54.7% | 41.0% | 29.1% |

Nathan Eovaldi
Probable | projected
|
TEX vs MIN
Score 58.6 | Lineup K 5.53
|
5.39 | 5.48 | +0.09 | 75.3% | 60.6% | 45.5% | 32.1% | 21.3% |
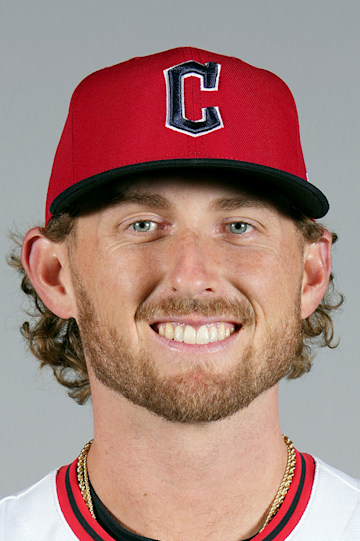
Tanner Bibee
Probable | projected
|
CLE vs KC
Score 54.0 | Lineup K 5.17
|
4.60 | 4.81 | +0.21 | 67.2% | 50.6% | 35.4% | 23.0% | 14.1% |

Michael Wacha
Probable | projected
|
KC vs CLE
Score 48.6 | Lineup K 4.35
|
5.00 | 4.77 | -0.23 | 66.6% | 50.0% | 34.8% | 22.5% | 13.7% |

Bailey Ober
Probable | projected
|
MIN vs TEX
Score 49.5 | Lineup K 5.36
|
4.36 | 4.71 | +0.35 | 65.8% | 49.0% | 33.8% | 21.7% | 13.1% |

Davis Martin
Probable | projected
|
CWS vs COL
Score 42.0 | Lineup K 5.00
|
4.38 | 4.57 | +0.19 | 63.7% | 46.8% | 31.7% | 20.0% | 11.8% |

Dustin May
Probable | projected
|
MIL vs STL
Score 42.3 | Lineup K 5.01
|
4.22 | 4.47 | +0.25 | 62.2% | 45.1% | 30.1% | 18.7% | 10.9% |

Hayden Wesneski
Probable | projected
|
HOU vs ATH
Score 45.9 | Lineup K 4.97
|
4.14 | 4.42 | +0.28 | 61.5% | 44.3% | 29.4% | 18.1% | 10.4% |
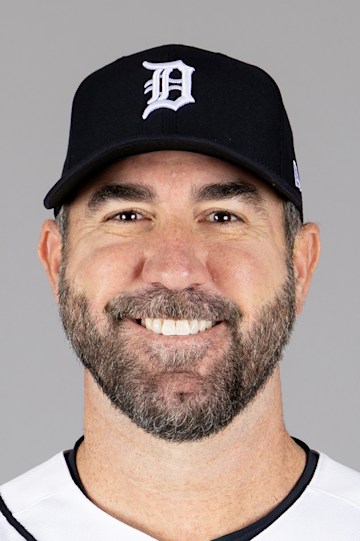
Justin Verlander
Probable | projected
|
DET vs PIT
Score 44.7 | Lineup K 4.78
|
4.18 | 4.37 | +0.19 | 60.7% | 43.4% | 28.6% | 17.5% | 10.0% |
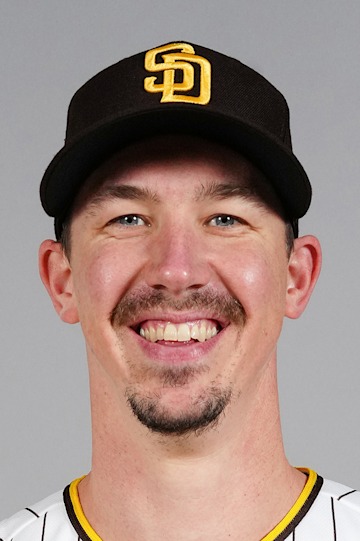
Walker Buehler
Probable | projected
|
SD vs AZ
Score 18.9 | Lineup K 3.40
|
3.49 | 3.37 | -0.12 | 42.7% | 26.0% | 14.4% | 7.3% | 3.5% |

Jose Quintana
Probable | projected
|
COL vs CWS
Score 38.5 | Lineup K 4.28
|
2.67 | 2.96 | +0.29 | 34.4% | 19.2% | 9.6% | 4.5% | 1.9% |
Methodology
How V1 Builds The Board
Baseline strikeout projections from the pitcher strikeout model are adjusted with a bounded matchup multiplier derived from lineup-level strikeout pressure, projected batting-order context, and pitch-matchup interaction. Threshold probabilities are generated from the matchup-adjusted mean using a deterministic negative-binomial-style count model with empirically estimated overdispersion.
Baseline
Daily Strikeout Model First
The baseline mean comes from the existing pitcher strikeout projection system, unchanged from the saved daily strikeout artifact.
Adjustment
Bounded Matchup Overlay
Public context is limited to the matchup score, lineup expected strikeouts, lineup confidence, and pitch-mix sample size. The adjustment stays modest and explainable instead of replacing the baseline model.
Probabilities
Threshold Ladder
The 4+ through 8+ probabilities are generated from the matchup-adjusted mean using the artifact's deterministic negative binomial style count layer.
Later
Ready For Market Comparison
This page can expand cleanly into sportsbook line comparison later by adding line, price, fair probability, and fair-price gap columns next to the existing baseline, adjusted mean, and threshold ladder.